Codifi
The whole field workflow in one product, built for crews with no signal.
- My part
- Product designer, then Head of Product. I designed it and wrote most of the frontend.
- When
- 2023 to 2026
- With
- A team of three. Hugo Bounoua, our solutions architect, built the sync and formula engines and much of the backend. Jonathan Sims, our project manager, ran QA and regression testing.
- Built in
- TypeScript, React, React Native and Mapbox
- Its site
- www.codifi.com, which I rebuilt as well.

What a year of it came to
- 13 to 108people recording in Codifi each month
- 777 to 11,190records captured in a month
- 17% to 44%of the firm’s field revenue on Codifi, 2025 jobs to 2026 jobs
- Days to hoursof data entry after fieldwork, in Memphis
August 2025 to August 2026 at Chronicle Heritage, except Memphis. On finished jobs, margins held. How the rollout went
One survey should not need six apps.
Fieldwork ran on a stack nobody chose. A form builder for the forms, a map app for the points, web GIS for the layers, a spreadsheet for checking, a database somebody built years ago, and a word processor for the report. Every seam between them was a manual handoff, and a place the data could go wrong.
Codifi replaces the seams. You set a project up once, collect on an iPad with no signal, check the data on the web before you leave the site, and the report is written from the same records.
The small things that save a field day
Eleven shipped features, each in a render of the real app. I designed them, and wrote most of the frontend they run on. Open any of them for a closer look.
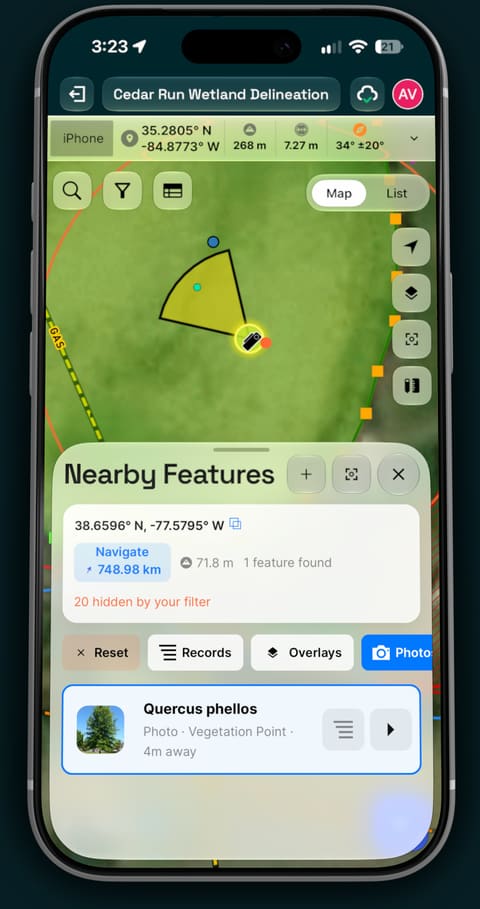
Photos on the map
Every photo lands where it was taken, with the direction it faced. Browse a site by where, not by filename.
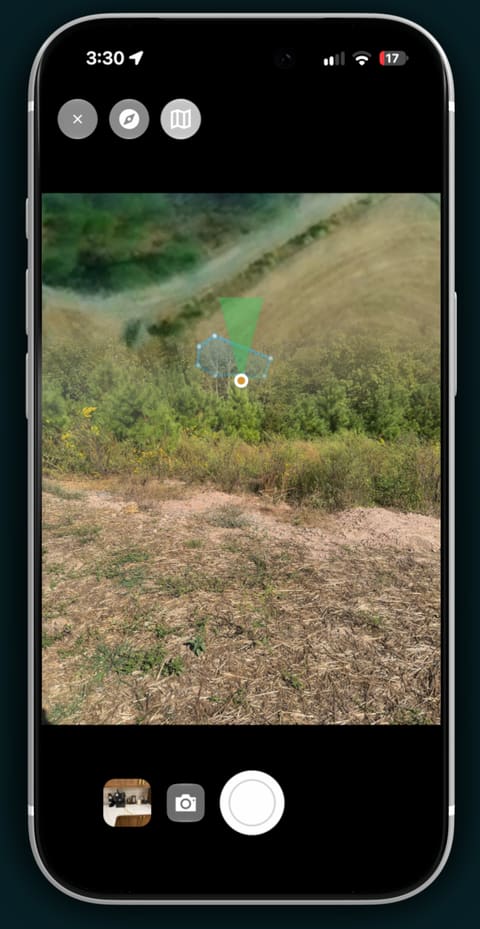
A camera that knows where it’s pointing
Heading and a heading-up mini map right in the viewfinder, so every photo carries its direction.
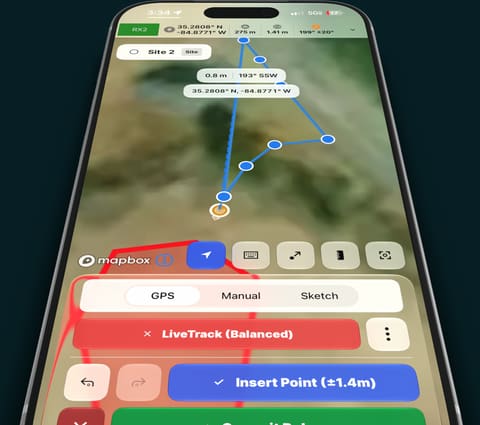
LiveTrack
Walk the boundary or the transect. The line draws itself as you go, with GPS accuracy on every point.
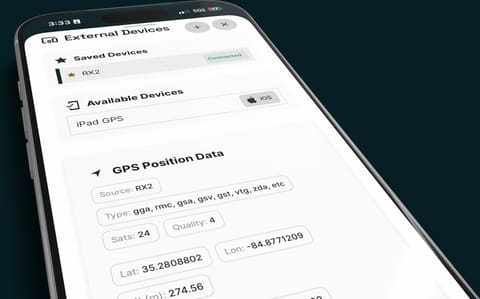
Bring your GNSS receiver
Pair a Bluetooth receiver. Satellites and fix quality ride along with every point you capture.
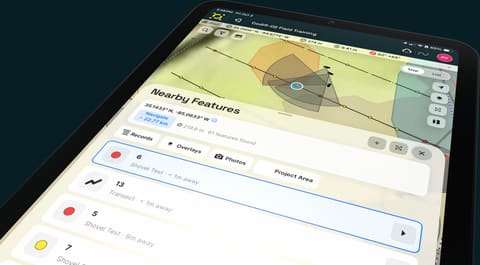
Nearby features
What’s around you right now: the closest records, overlays and photos, with distance and direction.
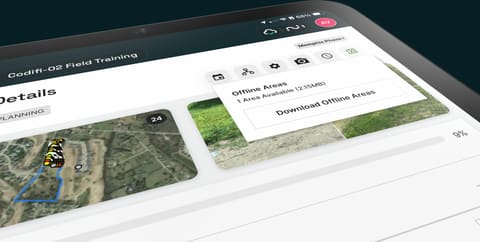
Offline map areas
Download the project area’s basemaps and imagery before you lose signal.
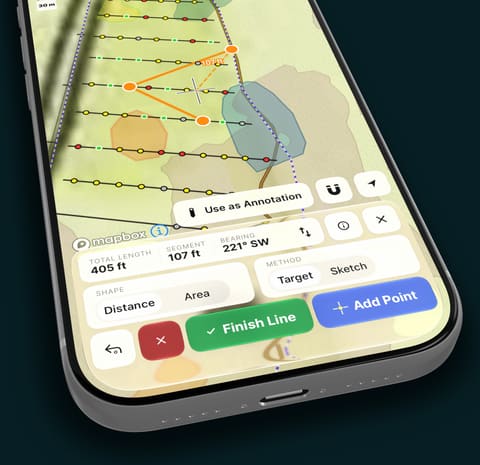
Measure anything
Distances, areas and bearings on the live map. Keep any measurement as an annotation.
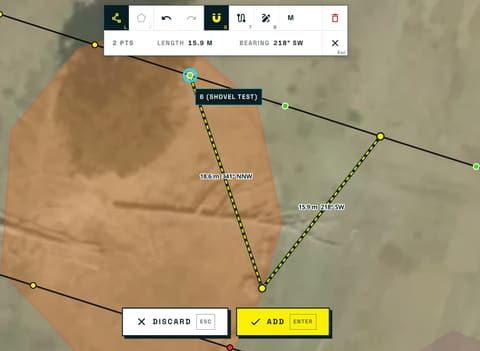
Magnetic snapping
Vertices land exactly on the feature you mean, and Codifi tells you which one by name.
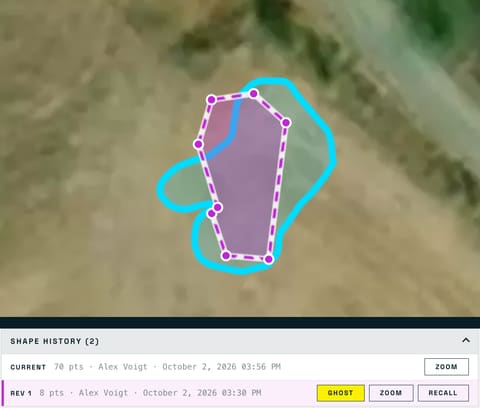
Shape history and recall
Every shape a location has had, with who changed it and when. Ghost an old one or recall it.
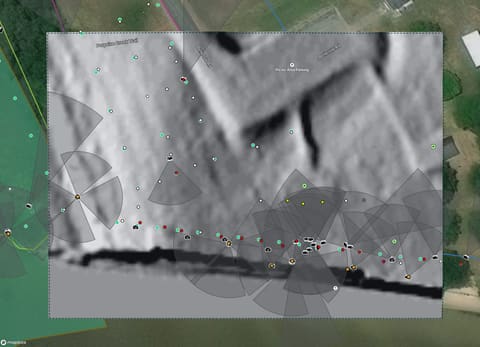
Imagery on demand
Hillshade, local relief, slope and historic imagery for any extent, kept as a layer and taken offline.
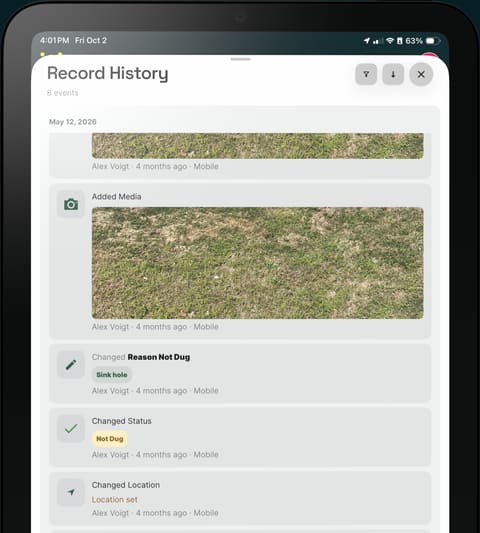
Record history
Who changed what and when, on every record. Review it before anything ships.


Sync a crew can see, and never has to manage
Hydra is Codifi’s offline-first sync engine, and Hugo Bounoua, our solutions architect, built it. My part was making it make sense to the people in the field: the cloud sync status, its icons, and the motion that shows what is happening and when.
The rule I held to was that sync should never be something a crew has to manage. Every change is saved on the device the moment it is made, and travels when there is signal. Nobody presses save, and nobody stands in a field watching a bar fill. When two people change the same field while they are apart, the most recent edit wins, and the older value stays in the history, where anyone can see it and bring it back.
Version 3.3 went a step further with Nearby Sync. Two tablets in the same field trade their records directly, with no internet involved. Later, whichever one finds signal carries the crew’s records up with it. Its icon is the next section.

Try it: two tablets, no signal
Better on a bigger screen.
This one is two tablets side by side with the office’s view under them. On a phone they stack into a long scroll.
Step 1 of 4Turn the signal off on both tablets.
Maya’s iPad
Turn the signal off
STP-014
Everything here is synced.
Sam’s iPhone
Turn the signal off
STP-014
Everything here is synced.
Both tablets have signal, and everything is synced.
What the office sees on the web
- Result
- Negative
- Depth
- 40 cm
| When | Who changed what | Recall |
|---|---|---|
| 9:12 | Maya on iPad. Depth: new to 40 cm | |
| 9:12 | Maya on iPad. Result: new to Negative |
Motion with a reason
Nearby Sync needed an icon for something nobody can see: two tablets trading records with no internet between them. I drew it out of Codifi’s own mark. Unwind the ring and it lays out as a stream between two points.
It moves only when something happens. Turn Nearby Sync on and the stream grows out of nothing. When someone connects, a pulse runs out and back, because sync goes both ways. Then it stops. At rest it is a still drawing, so an icon that sits in the nav bar all day costs the battery nothing.
I worked the motion out as a prototype with an AI agent, then built it into the app.
Try it: the Nearby Sync icon
Nearby Sync is on and nothing is happening, so nothing is moving. The icon is a still drawing.
One design system, three surfaces
I owned Codifi’s design system. We refined it with an outside agency, and then I led a full redesign across the web app, the mobile app and the marketing site, so a crew lead on an iPad and a GIS analyst at a desk are plainly looking at the same product.
I designed in code. A prototype in the real product went to a field crew, and what came back went into the next build. I also designed how the product is presented. These are its App Store screens.


Maps, and knowing exactly where you stand
Most of what I built with my own hands is here. A record in the field is a place before it is anything else, so the map had to be good enough to trust and quick enough to use with gloves on.
LiveTrack, snapping, the camera compass and external GPS are in the details above. I added Emlid and Bad Elf receivers to the app’s GPS bridge myself. Two more tools did the daily work:
- Draw Mode
- Capture and edit points, lines and polygons on the device, with vertex editing and undo.
- Offset Capture
- Record a point you cannot stand on, from a bearing and a distance.

Native where it counts
The mobile app is React Native, and I treat that as a way to reach the platform, not a way round it. In the current release the interface uses SwiftUI components through Expo UI, native sheets, and the system’s Liquid Glass material, so it behaves like the iPad it runs on.
Where React Native stopped, I wrote the native part: a diagnostics module in Objective-C that reports memory, CPU and thermal state, several Expo config plugins, and support for Emlid and Bad Elf receivers in the app’s GPS accessory bridge. The bridge itself is mostly a colleague’s work. Those two protocols are mine.
From version 2.0 on I also ran the iOS releases, building the app and uploading it to App Store Connect, and took it through two Expo SDK upgrades.
Ripple: forms that do the math
Ripple is Codifi’s formula engine, and Hugo Bounoua built it. Someone writes a rule once, in the project’s template, and it runs everywhere the form does: on an iPad with no signal, in the browser, and on the server. It adds up repeating rows, reaches up to a parent record, asks a question only when it applies, and does geometry: area, length, distance to a line.
What I cared about was how that feels to fill in. A calculated field is marked, so you know a formula is behind it. If you type over it, your value stands, because the person at the hole knows something the formula does not. And a question that does not apply is simply not there.

Try it: a shovel test that fills itself in
Better on a bigger screen.
This one is a form beside a small map and the rules that drive it. On a phone they stack into a long scroll.
A shovel test on transect T-2
STP-014
Stratigraphy
| Top (cm) FX | Bottom (cm) | Texture | Thickness FX |
|---|---|---|---|
Step 1 of 5
Change where the first horizon ends. Try 30.
Result
Location
Drag the point, or use the sliders.
The six rules behind this form
ValueTop
The first horizon starts at the surface. Each one after starts where the one above it ended, and nobody types it.
{"if": [ {"==": [ {"rowIndex": [ {"var": ""} ]}, 0]}, 0, {"repeaterFieldAtRow": ["Horizon", "Bottom", {"-": [ {"rowIndex": [ {"var": ""} ]}, 1]} ]} ]}Right now: 0 cm, 20 cm
ValueThickness
Each horizon’s thickness is its bottom minus its top.
{"-": [ {"getFieldByLabel": [ {"var": ""}, "Bottom"]}, {"getFieldByLabel": [ {"var": ""}, "Top"]} ]}Right now: 20 cm, 25 cm
ValueTotal Depth
Total depth is the deepest horizon’s bottom. If you type a depth yourself, yours wins.
{"maxRepeater": ["Horizon", "Bottom"]}Right now: 45 cm
VisibilityArtifact Count
Only ask how many artifacts when the result is Positive.
{"==": [ {"getFieldByLabel": [ {"var": ""}, "Result"]}, "Positive"]}Right now: hidden
ValueDistance from Transect
Measure from this point to its parent transect’s line, to a tenth of a metre.
{"round": [ {"pointToLineDistance": [ {"var": ""}, {"parent": [ {"var": ""} ]} ]}, 1]}Right now: 3.3 m
VisibilityOff the line
Warn when the point is more than 10 m off the transect.
{">": [ {"getFieldByLabel": [ {"var": ""}, "Distance from Transect"]}, 10]}Right now: hidden
Reports: the deliverable writes itself
The report is the reason the fieldwork happens. In Codifi it is a Word or Excel file with tags in it. You bring the template your agency already accepts, and the server fills it from the records: fields, tables of child records, photos with their captions and bearings.
Nothing is retyped, so nothing is mistyped. The Memphis office cut its post-field data entry from days to hours.
Try it: one template, the same records
This report is written from the shovel test in the form above. Go back and mark STP-014 Positive, and the last line here changes.
Anything in double curly brackets is filled in from the records. Edit it. A tag the engine cannot read prints __INVALID TAG__, the way a real report does.
The report
Transect T-2: shovel test results
Recorded by Maya R. on October 14, 2026
3 shovel tests were dug on this transect.
| STP-012 | Negative | 60 cm |
|---|---|---|
| STP-013 | Positive | 45 cm |
| STP-014 | Negative | 45 cm |
Cultural material was found. See the positive tests above.
Every tag was filled.
Four feature releases in seven months
Over the last year I wrote about half of the web app’s commits and more than half of the mobile app’s, while owning the roadmap, the docs and the release notes.
These four are the feature releases of 2026. I have been on the product since version 1, through version 2 and more than 25 releases since. I also cut the iOS builds and uploaded them to App Store Connect myself.
Version 3.0
February 12, 2026
Hydra, the offline-first sync engine. Activity history on every project and record.
Version 3.1
March 31, 2026
Calculated fields and conditional visibility. Annotation and measurement. LiveTrack. QR codes and batch record creation. A QA table on the device.
Version 3.2
June 24, 2026
A redesigned web app. Raster map layers. Overlay data tables. Navigate To. A refreshed data entry screen. Auto-numbering.
Version 3.3
August 23, 2026
Nearby Sync. Single sign-on and multi-factor sign-in. Camera Compass. Magnet Snapping and Offset Capture. Draw Mode on the web. File Geodatabase export.
Building with AI agents
Since August 2025 I have written production code with Claude as a daily collaborator: more than 1,100 AI-assisted commits across the web and mobile apps.
The part that mattered was not the typing. It was writing down what the project knows, in a form an agent can use: layered docs that say how this codebase works, what its conventions are, and what not to touch. People read the same docs, and they are better for having to be that clear.
Then I taught the team. I wrote the guide a new teammate used to pick the workflow up.
Then get a whole company to use it
In August 2024 Codifi was folded into its parent, Chronicle Heritage, a cultural resource management firm of more than 600 people working in all 50 states. Its offices ran fieldwork on web GIS, map apps, form builders and databases built by hand for each kind of project. My job became replacing all of it with one workflow, in more than twenty offices and practice groups at the same time.
That is a people problem more than a software one: a new tool costs good people time before it saves them any. So we built a cycle we could run with every team at once.

The cycle
- Deliverable inThe report or agency form the team has to produce, and the forms it uses today.
- An agent builds itThe composition, its forms and a demo project, set up in a sandbox for the team.
- They pick it apartThe team tries the demo against its own work, in a meeting with us.
- Recap and triageWhat changed and why, and a new demo. Back to step two until it fits.
- Into the fieldAnd when the product was the problem, the fix went to every team.
Around the cycle: training for crews and managers, site visits in Phoenix, Tallahassee and Memphis, and more than 40 data models moved by API. What it came to is at the top of the page.
I had done this before, under a different title. Nine years as a pastor was nine years of helping people through change they did not ask for. The rest of that story is on the timeline.
The demos on this page are mine. They do what Codifi’s public documentation says a crew will see, and contain none of Codifi’s code.